Guidance for Developing Accessible Excel Content
Microsoft Excel documents are commonly used to organize, calculate, and share data. When created correctly, Excel files can be accessible to users who rely on assistive technology such as screen readers.
Accessible Excel documents improve usability for all users and help ensure that materials published on the MCCB website meet accessibility standards.
Before You Create
Before creating or submitting an Excel document, consider whether a spreadsheet is the most appropriate format.
- Can this content be presented as a webpage instead?
- Is Excel necessary for data manipulation or analysis?
- Is the document structured clearly for users who may not visually interpret the layout?
- Is this document current and necessary for website publication?
The MCCB website is not a document repository. Only necessary, accessible documents should be submitted for publication.
Creating Accessible Excel Documents
Accessibility in Excel depends on how data is structured, labeled, and organized.
Step-by-Step Guide
Structure Your Data Clearly
- Headers
Header rows identify what each column of data represents. In Excel, headers help users understand how information is organized and make tables easier to navigate.
Setting Header Rows
- Open the Excel file.
- Select the range of cells that contains your data.
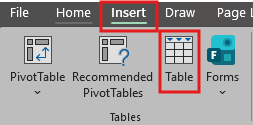
- Go to the Insert tab.
Select Table.
- Confirm the correct data range is selected.
Check the box for My table has headers.
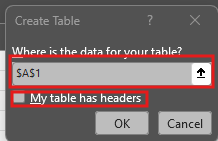
- Select OK.
- Review the table to confirm each column has a clear, descriptive header.
Best Practices
- Use short, clear column names.
- Avoid leaving header cells blank.
- Use one header row when possible.
- Avoid merged cells in header rows.
- Blank Cells
Blank cells can interrupt how screen readers interpret data. Users may not know whether the cell is intentionally blank, missing information, or the end of the table.
Checking Blank Cells
- Open the Excel file.
- Review each table for empty cells, rows, or columns.
- Remove blank rows or columns used only for spacing.
- If a cell is intentionally blank, add text such as N/A, Not Applicable, or No Data when appropriate.
- Use formatting, spacing, or borders instead of blank rows to separate sections visually.
Best Practices
- Avoid blank rows or columns inside data tables.
- Use consistent labels for missing or unavailable data.
- Keep tables continuous from the first row to the last row.
- Do not use blank cells to create visual layout.
- Merged Cells
Merged cells can make tables difficult for assistive technology to read because they change the normal row-and-column structure.
Checking for Merged Cells
- Open the Excel file.
- Select the worksheet or table you want to review.
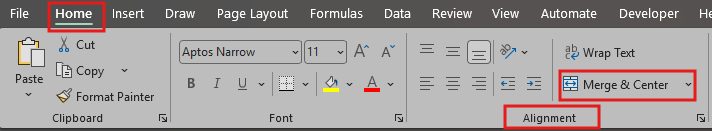
- Go to the Home tab.
- Look in the Alignment group.
If Merge & Center is highlighted, the selected area contains merged cells.
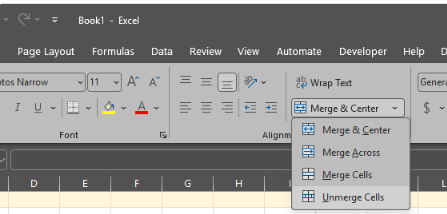
- Select Merge & Center.
Choose Unmerge Cells.
- Adjust the layout using regular cells, alignment, or formatting instead.
Best Practices
- Avoid merged cells in data tables.
- Use Center Across Selection when a visual title needs to appear centered.
- Keep each piece of data in its own cell.
- Split complex tables into smaller, simpler tables when needed.
- Unclear Sheet Names
Worksheet names help users understand what information is included on each sheet. Names like “Sheet1” or “Data” may not provide enough context.
Renaming Sheet Tabs
- Open the Excel file.
- Find the sheet tabs at the bottom of the workbook.
- Right-click, the sheet tab you want to rename.
- Select Rename.
Enter a short, descriptive name.
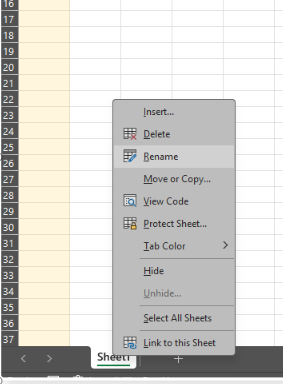
- Press Enter.
- Remove any blank or unused sheets.
Best Practices
- Use names that clearly describe the worksheet content.
- Avoid generic names such as Sheet1, Sheet2, or Data.
- Keep sheet names short but meaningful.
- Use consistent naming across related worksheets.
- Color-Only Indicators
Color should not be the only way information is communicated. Users who are color blind, have low vision, or use screen readers may not receive the meaning if color is the only indicator.
Checking Color-Only Meaning
- Review the worksheet for information identified only by color.
- Look for instructions such as “items in red are required” or “green means approved.”
- Add text, symbols, or labels to explain the meaning.
- For example, instead of using only green and red cells, add labels such as Approved, Pending, or Not Approved.
- Review charts and graphs to ensure labels are included.
Best Practices
- Use text labels along with color.
- Make sure charts include titles, legends, and data labels when needed.
- Avoid using color alone to show status, priority, or required fields.
- Check that text has strong contrast against the background.
- Missing Alt Text
Images, charts, graphs, icons, and other visuals need alt text when they provide meaningful information. Alt text helps users who rely on screen readers understand the purpose of the visual.
Adding Alt Text
- Select the image, chart, or visual.
- Right-click the visual.
Select View Alt Text or Edit Alt Text.
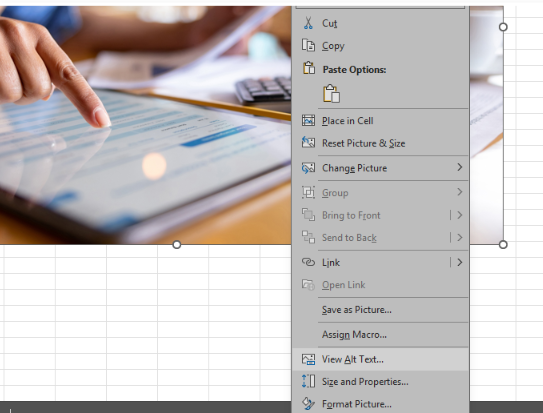
- Enter a short description that explains the purpose or meaning of the visual.
If the visual is decorative only, mark it as decorative if that option is available.
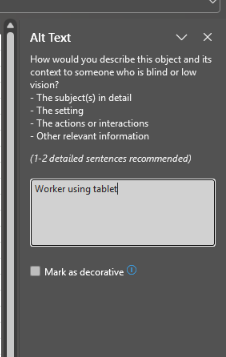
- Close the Alt Text pane.
Best Practices
- Describe the meaning or takeaway, not just the appearance.
- Keep alt text clear and concise.
- Do not begin with “image of” or “picture of.”
- For charts, summarize the main trend or key information.
- Unclear Links
Links should clearly explain where they take the user. Raw URLs or vague phrases may be difficult to understand, especially for users navigating with a screen reader.
Creating Descriptive Links
- Select the text you want to turn into a link.
- Right-click the selected text.
- Select Link.
- Enter or paste the web address in the address field.
Select OK.
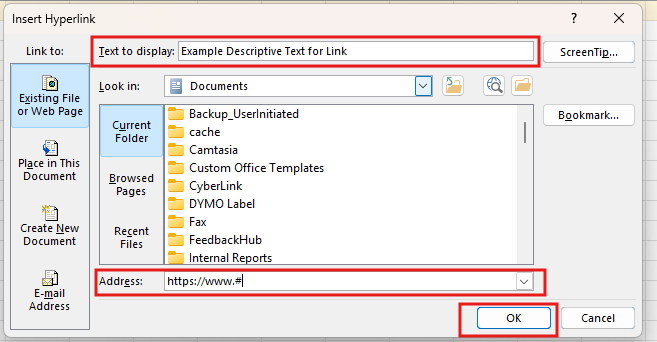
- Review the link text to make sure it describes the destination.
Best Practices
- Avoid vague text such as Click here, Read more, or Link.
- Avoid using the full URL as the visible link text unless necessary.
- Use descriptive link text, such as View the Annual Report.
- Include the file type when linking to a document, such as View the Annual Report PDF.
Run the Accessibility Checker
- Select the Review tab.
Select Check Accessibility.
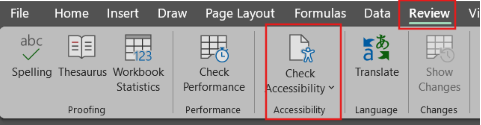
- Review any errors, warnings, or tips.
- Fix all identified issues before submission.
Tools and Resources
Support Pages
- National Center on Disability and Access to Education: Excel Cheatsheet
- Microsoft Support: Make your Excel documents accessible
- WebAIM: Accessible Data Tables
- Section508.gov: Spreadsheet Accessibility Guidance